Crypto Revolution 2023: Meet the Top 5 Coins Changing the Game!
- Solana meme coin BONK gains attention with a notable surge, sparking interest in the crypto community.
- Solana's rapid rise in 2023 surpasses XRP and BNB, elevating it in market cap rankings.
- The cryptocurrency market achieved a total market capitalization of $1.75 trillion.

2023's hot coins: Thriving trends, stellar performance!
Approaching 2023, the cryptocurrency market basks in a green resurgence. Uncover the standout performers of the year, as it unfolds with a blend of challenges and triumphs. Despite the initial fallout from FTX exchange's abrupt downfall, year-end showcased a positive turn, witnessing remarkable growth in various altcoins, unprecedented in years.
Top Five Coins that have performed well in 2023
Bonk
BONK, a meme coin built on the Solana blockchain, has recently garnered significant attention within the crypto community due to its remarkable surge. The token's ascent has been fueled by its listing on major cryptocurrency exchanges, propelling it to an all-time peak of $0.000035000 and establishing a market cap of approximately $1.12 billion.
The positive momentum for Bonk (BONK) has persisted since late October, with a notable 232% surge from December 2, coinciding with its introduction on KuCoin for trading against USDT (Tether).
During November, BONK witnessed a remarkable surge of 900%, establishing itself as a standout performer in the recent crypto market scenario. This impressive growth can be partially linked to the generally positive trend observed in the cryptocurrency market in the initial days of November. Following resistance at $45,000 and a speculative boon in BONK, selling pressure emerged, leading to a retracement and consolidation within a specific range.
BONK Technical Analysis:
Since its market debut, BONK initially trended downward, dropping from its first peak of $0.0000052 on January 6 to its lowest point of $0.00000017 on October 15. This marked the first consolidation phase after its initial surge, bringing the price close to its starting level.
Starting from October 20, a new uptrend emerged, leading to a remarkable 17,520% increase in price and reaching a new high of $0.00003500. Subsequently, the price entered a retracement phase, declining by 50% from the peak to $0.00001740. If the price maintains the $0.00001740 level and the 50% Fibonacci retracement level, there is potential for another rally toward a new high.

Solana
Solana has experienced unexpectedly rapid growth in popularity this year, surpassing both XRP and BNB in market cap to climb the ranks of top cryptocurrencies. The price of Solana (SOL) reached a historic 20-month peak of $126 on December 25th.
Foremost among these catalysts is the influential endorsement from key figures such as Cathie Wood, the CEO of Ark Invest. Wood's positive commentary on Solana, particularly emphasizing its speed and cost-effectiveness in comparison to Ethereum, has significantly bolstered investor confidence. This endorsement not only brought increased visibility to Solana but also added a layer of credibility to the platform, prompting more market participants to take notice.
Furthermore, Solana received a notable vote of confidence earlier in the year from Vitalik Buterin, the co-founder of Ethereum. Buterin expressed a bullish outlook on the Solana network, advocating for providing the blockchain ample opportunity to thrive. Such endorsements from respected figures in the crypto space have played a pivotal role in shaping positive sentiment and attracting new participants to the Solana ecosystem.
In a groundbreaking development, Solana surpassed Ethereum in NFT (Non-Fungible Token) volume in late June, marking a significant milestone for the platform. Within a 24-hour period, Solana recorded $25.5 million in NFT volume, outpacing Ethereum's $24.7 million. This achievement can be primarily attributed to the successful launch of SMBs (Solana-native NFT marketplaces), underscoring Solana's growing dominance in the NFT space.
Solana Technical Analysis:
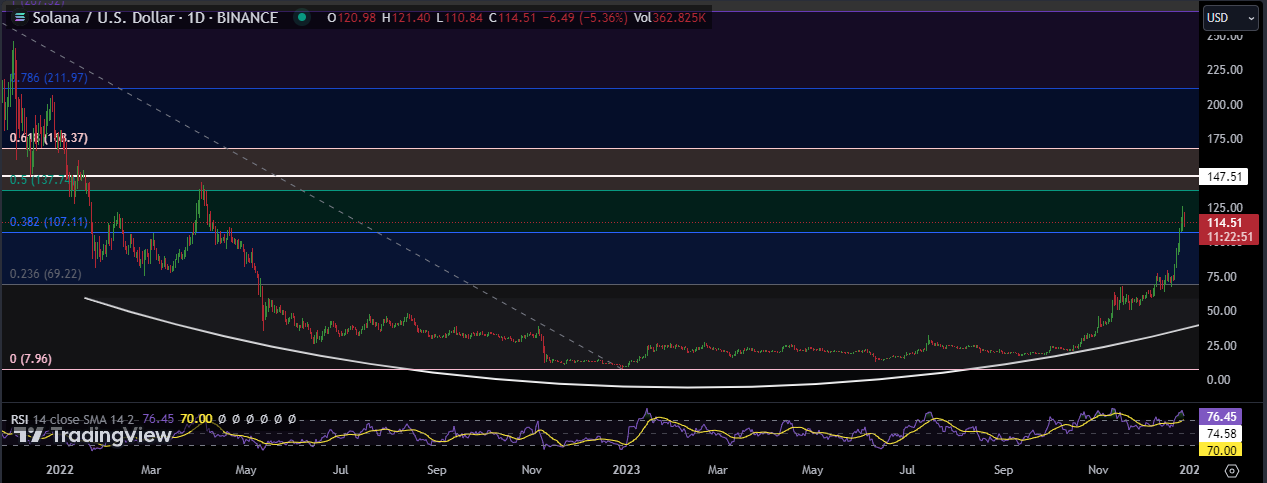
As of January 1, 2023, Solana was trading at a modest low of around $10, maintaining a consolidated pattern for nearly nine months. However, starting in October, Solana embarked on an impressive recovery in the daily timeframe, exhibiting a parabolic surge from $21.00 to its current trading level of approximately $115. This remarkable upswing reflects a substantial 500% increase in value.
In terms of Fibonacci retracement, SOL successfully surpassed the 23.6% level according to FIBO, triggering a notable upward movement. The subsequent breakthrough of the 38.20% level, a significant psychological milestone at $100, marked a robust bullish sentiment. Sustaining this momentum, SOL reached a peak of $126.35 before witnessing some profit-taking at higher levels. Crucially, SOL managed to maintain a position above the 38.2% Fibonacci retracement level.
If SOL holds this level, the potential for further gains is evident, with the next targets at the 50% Fibonacci retracement levels around $138, $168 and $212. The weekly chart further supports this positive outlook, revealing a Rounding Bottom Pattern that contributes to Solana's overall upward trajectory.
Render
Today, the Render Network Foundation successfully migrated its tokens to Solana, rebranding the coin from RNDR to RENDER. With a market capitalization of $1.9 billion, RENDER has experienced a remarkable surge in 2023, boasting a staggering 1,190% growth and securing the fourth spot among Ethereum-based tokens with a market cap exceeding $10 million.
Established in 2017, Render Network operates a marketplace for idle GPU compute, allowing users to contribute unused GPU power for rendering motion graphics and visual effects. Artists can harness this network to access untapped computing power. Rendering involves the process of creating an image from a 2D or 3D model using a computer program.
Render Technical Analysis:
In the realm of technical analysis, RNDR has undergone a remarkable bullish surge throughout the year, registering a staggering 1,160% increase since January. The culmination of this upward momentum led to a significant milestone with a new annual high of $4.98, marking the highest price point in over 700 days.
Critical to this surge was RNDR's breakthrough from a pivotal horizontal resistance area entrenched since April. This breakout not only expedited the pace of ascent but also positioned the price with just one remaining resistance barrier before reaching the all-time high. The technical indicators suggest a favorable landscape, with the potential for further upward movement in the near future.

Injective
Injective (INJ), the financial blockchain incorporating Artificial Intelligence (AI), achieved an unprecedented price of $44.85 on December 24, concluding a remarkable year with gains surging by an astounding 3,500%. Major investors in the Injective ecosystem began bolstering their holdings as INJ surpassed its previous all-time high of $22.
In 2023, INJ embarked on a parabolic climb, reaching a new all-time high before experiencing a modest decline. Despite some indications of temporary weakening, the overall outlook remains highly optimistic for sustained price growth.
Operating on the Cosmos-based blockchain, Injective seamlessly integrates AI with decentralized finance (DeFi). Noteworthy is INJ's impact in the DeFi sector, boasting over 180,000 active addresses and aiming to surpass 200,000 shortly, as revealed by the official X account.
Injective Technical Analysis:
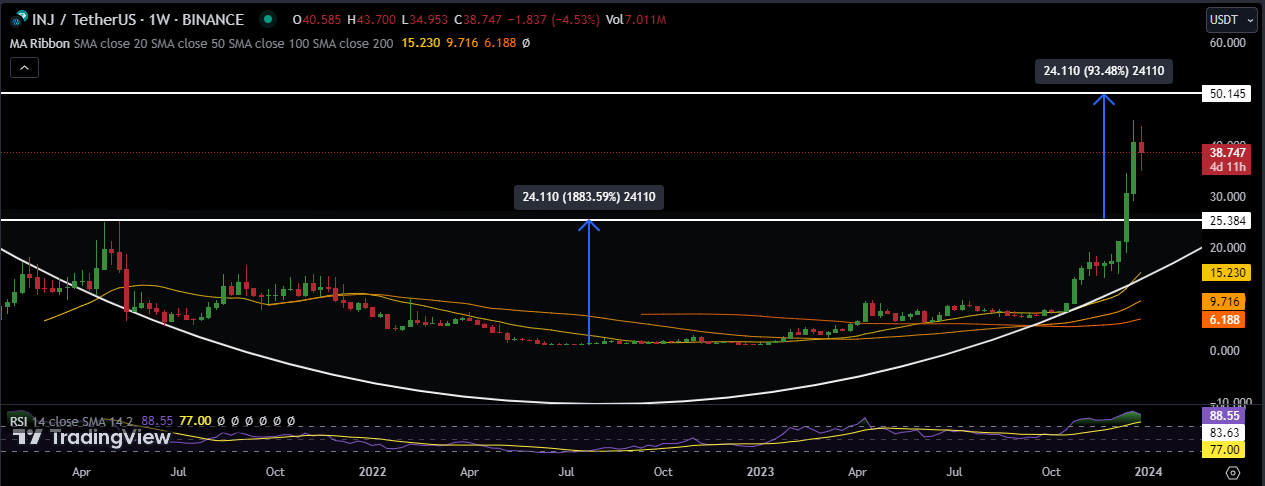
Injective coin witnessed a significant breakout on December 13th, surpassing the $25.4 neckline resistance of the rounding bottom pattern. On December 26th, the price reached a new pinnacle at $44.85, fueled by intensified buyer accumulation. Despite this, the current phase sees minor rejections hindering the ongoing surge.
Potential resistance looms around $50 in the upward trajectory. If a reversal occurs near this point but maintains levels above $35, it signals favorable market sentiment, with investors seizing opportunities at lower prices. This scenario increases the likelihood of the price surpassing $50, potentially reaching $55-$62 in the upcoming week.
Kaspa
Since June, Kaspa (KAS) has surged an impressive 650%, emerging as the best-performing cryptocurrency. Functioning as a decentralized, open-source, and highly scalable layer-1 blockchain with the GHOSTDAG consensus mechanism, Kaspa ensures rapid and secure transactions.
The upswing in KAS's value is attributed to Bitcoin cloud mining prospects, OKX wallet integration, and an upcoming $1 million airdrop. In 2023, Kaspa achieved a significant milestone, processing 10 transactions per second. The latest boost comes from Binance listing KAS for perpetual trading.
Additionally, Kaspa has expanded its presence by being listed on Bitrue and Exchang.io exchanges. Bitrue, a Singapore-based platform, offers over 200 trading pairs and has initiated a BTR vote campaign for Kaspa. Meanwhile, Exchang.io, a UK-based exchange, supports 100+ trading pairs. These developments underscore the growing popularity and success of the KAS coin.
Kaspa Technical Analysis:
From January onwards, Kaspa has witnessed a remarkable surge of approximately 2400%. Technical analysis of Kaspa's price movement suggests a bullish trend both in the short and long term. The heightened buying activity indicates an aggressive stance by investors, particularly larger players who appear to have injected substantial capital at lower price levels, leading to a significant uptick.
The price of KAS has demonstrated strong performance, recording a notable 155% increase in November 2023. This surge is underpinned by a substantial increase in buying volume, signifying significant accumulation by major market participants during lower price phases.
Currently, the KAS price is retracing back to the breakout level, anticipated to serve as robust support for bullish sentiments. The observed price action indicates active buyer participation within the demand zone, suggesting that any minor sell-off is likely to be absorbed without significant impact.
Analyzing Fibonacci retracement levels, a retracement of approximately 30% from the peak at $0.154890 has occurred. Presently, the price is finding support at the 61.80% Fibonacci level, coinciding with the breakout level, reinforcing its significance as a strong support zone for bulls. In the event of a resurgence in bullish momentum leading to a breach of the previous high, the price could potentially reach levels of $0.220000 and $0.260000 in the near future.
Given the proximity of the crypto market conditions, this presents an opportune moment to consider buying at lower levels.
